
01
Electricity in, heat out
A data centre is a building full of computers that run websites, apps and AI. Its working cycle is simple: electricity comes in, and heat goes out. Power arrives on a grid line and steps down in the substation. Rows of diesel generators stand beside the data hall. On its roof, a chiller cools water much like a large fridge, and dry coolers pass the heat to the outside air.
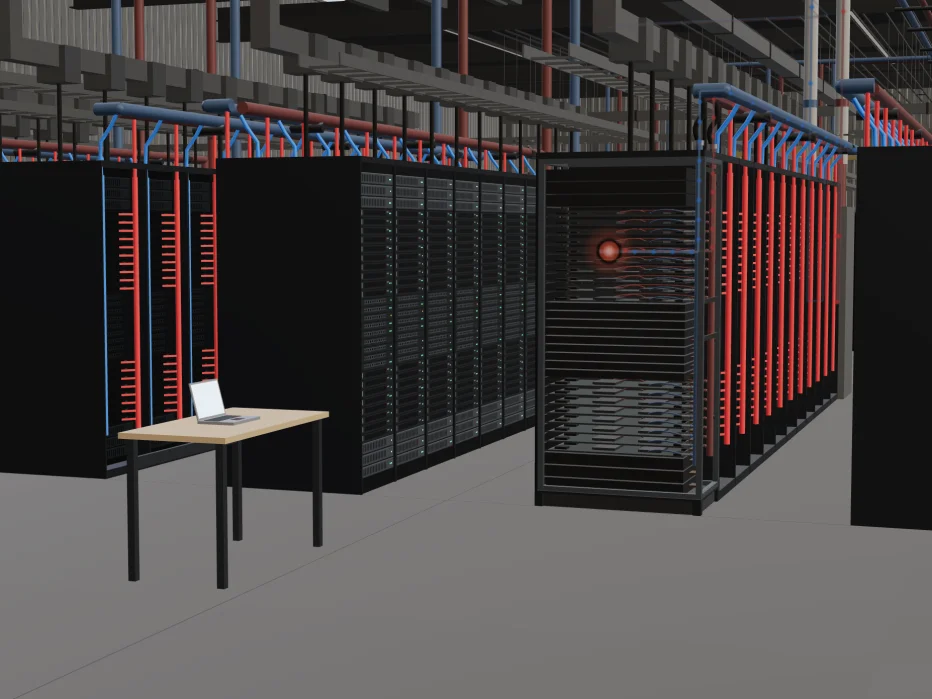
Inside the hall stand the racks, tall steel cabinets packed with computers. This model's hall holds 192 racks in 16 rows, a layout of its own, since real halls come in every size. With every rack at full load, the computers draw about 23 MW. Add the cooling and the power lost on the way, and an average site takes about 35 MW from the grid. The last chapter shows how the best sites do better.
Together, the world's data centres used about 415 TWh of electricity in 2024. That is about 1.5 percent of all the electricity the world used. The International Energy Agency expects about 945 TWh by 2030. The very largest sites are called hyperscale, and there were 1,136 of them at the end of 2024. Google opened its first data centre in 2006, in The Dalles, Oregon.
The glowing marker shows where the energy is at each moment of the playback: amber while it is electricity, red once it has turned into heat. Energy does not travel in single lumps, but tracking one small amount of it shows where all of it goes. Electricity reaches a chip in under a microsecond, and the heat then needs about a minute to leave through the roof. So the playback stretches the fast part and compresses the slow one, and the clock shows the model's timing, not a measurement.
- Racks in this model
- 192, in 16 rows
- Power to the computers
- 23.0 MW
- Power from the grid
- about 35.5 MW at a PUE of 1.54
- All data centres worldwide
- about 415 TWh in 2024, 1.5% of the world's electricity
02
Power that must not stop
Electricity arrives on the grid line at high voltage, which carries power over long distances with little loss. The substation and its transformers step the voltage down, and smaller transformers step it down again near the hall. Each one passes on about 98 to 99 percent of the energy. The voltages here are one example; every site chooses its own.
Next comes the switchgear, a wall of large switches that route the power and isolate any part that fails. The power then passes through the UPS, short for uninterruptible power supply, and its batteries. If the grid fails, the batteries take over at once and can carry the hall for minutes, typically 5 to 15. From there the busway, thick metal bars inside a long case, carries the power into the hall and along the rows.
Batteries only buy time. The real backup is the diesel generators. Safety codes require them to take over within 10 seconds, and real sites take anywhere from 10 to 60. One such set, Caterpillar's Cat 3516C, delivers about 1.8 MW, weighs about 17 tonnes and burns about 466 litres of diesel an hour at full load. Larger versions reach about 2.5 MW.
Press Cut the grid to run a drill. The batteries carry the hall while the generators start. The generators then take over and the batteries recharge. In this model the grid returns after 20 seconds, a length chosen for the drill, and the generators wind down. Sites are rated by how well they handle failures: a Tier III site can be serviced without shutting down, and a Tier IV site keeps running through a fault. Even so, power problems caused 45 percent of serious outages in 2025.
- Voltage steps, one example
- medium voltage, then 415 V AC, then about 50 V DC
- Generators take over
- within 10 s by code, 10 to 60 s at real sites
- Batteries last
- typically 5 to 15 minutes
- One generator set
- about 1.8 MW, about 17 t
- Diesel at full load
- about 466 litres an hour
- Serious outages caused by power
- 45% in 2025
03
Inside a 120 kW rack
The power is heading for an Nvidia GB200 NVL72 rack. It holds 72 GPUs, the chips that do the maths for AI, and 36 CPUs, the chips that run everything around them. They sit on 18 compute trays, flat drawers that slide into the rack. Between them, 9 switch trays link all 72 GPUs together. The order of the trays here is the model's own.
Power enters at the top and the bottom, into six power shelves. They convert the hall's alternating current (AC) into direct current (DC) at about 50 V. The DC busbar, thick copper bars down the back of the rack, feeds every tray with up to 1,400 A. At about 50 V, that comes to about 70 kW, well short of the rack's 120 kW. So in this model the busbar has an upper and a lower half, each fed by three shelves. The real split is not published.
At full load the rack draws about 120 kW, and HPE lists 132 kW for its version. Roughly a tenth of the power from the grid is lost before it reaches the rack, as heat in the transformers, the UPS and the power shelves. The rack weighs roughly 1.4 tonnes, about as much as a mid-size electric car. Many halls stand on a raised floor, with cables and air running underneath. A standard one is not built for that much weight on a small area, so AI halls need a stronger floor.
Inside a GPU, the electricity switches tiny transistors on and off to do the maths. That work keeps none of the energy: almost all of it turns into heat at once, inside the chip. The chip close-up shows one chip 10 times larger, with its sizes drawn, not measured. Small tray fans still cool the network cards and storage. Switch to Idle to see the load drop. In this model an idle rack still draws 30 percent of its full power.
- Rack power now
- 120 kW
- Chips
- 72 GPUs, 36 CPUs
- Trays
- 18 compute, 9 switch
- DC busbar
- up to 1,400 A at about 50 V
- Weight
- about 1.4 t
- Lost before the chip
- roughly a tenth, as heat
- Fans
- small tray fans, spinning fast
04
A few microseconds apart
Large AI jobs are split across many GPUs, so the chips exchange data constantly. Inside the rack they use NVLink, copper links that run through the switch trays. Each GPU can send and receive 1.8 TB/s, and the whole rack 130 TB/s. TB/s means terabytes per second, a trillion bytes every second.
Between racks, the data goes through network switches. Each row has a leaf switch at its end. Every leaf is wired to every spine switch, the backbone in the middle. So any rack can reach any other in three hops: leaf, spine, leaf. This model draws two spines and one leaf per row, while real halls have far more.
A fast switch, such as Arista's 7060X6, adds about 700 nanoseconds. A nanosecond is a billionth of a second. In glass fibre, light needs about 5 microseconds to cover a kilometre. So crossing the hall takes just a few microseconds, or millionths of a second. Watch the green dashes run from the fibre entry through the switches to the rack.
The longest delay is the path to the user. A round trip through the fibre to a city 1,000 km away takes about 10 milliseconds. For a city 100 km away, it takes about 1. That counts the fibre alone. The software adds its own time on top. Pick a distance to compare.
- NVLink inside the rack
- 1.8 TB/s per GPU, 130 TB/s in all
- One switch hop
- about 700 ns
- Light in fibre
- about 4.9 µs per km
- Across the hall
- about 2.6 µs, three switches and the fibre
- Round trip to the user
- about 9.8 ms, fibre alone
05
Getting the heat out
The energy is now heat, and it has to be removed. On each chip sits a cold plate, a metal block with water flowing through it. In a keynote, Nvidia said the water enters the rack at about 25 °C and leaves at about 45 °C. This model sets its pump flow so that a full rack warms the water by those 20 degrees.
The manifold, pipes down the side of the rack, sends the warm water along the row to the coolant distribution unit, or CDU. There the heat passes into a second loop, the facility water that serves the whole building. The two waters never mix. The facility water runs about 5 degrees colder, so it must arrive at about 20 °C. One CDU, CoolIT's CHx2000, moves 2 MW of heat and stands on about 1.2 m² of floor. This model gives each row one.
The facility pipes carry the heat up to the roof. Water at 20 °C is cooler than many summer days, so the chiller first pumps heat out of it. Then the dry coolers blow outside air over hot coils, and the heat leaves the site as warm air. Here every loop is closed, so very little water is used. Many sites use cooling towers instead, which cool by evaporating water. US data centres used about 66 billion litres on site in 2023.
Pick Air to swap in air-cooled racks, the traditional approach. Fans pull cool air in at the front of each rack and blow it out the back, into a hot aisle: the gap between two rows where the warm air gathers. Air handlers then pass its heat into the same facility water. Air holds far less heat than water, so each kW needs about 272 m³ of air an hour. Some sites put their heat to use: in Odense and Stockholm, data centres help warm homes.
- Temperature rise through the rack
- the water leaves 20 degrees warmer
- Facility water
- about 20 °C, 5 degrees below the rack loop
- One CDU
- 2 MW of heat on about 1.2 m²
- Water per unit of computing, US
- about 0.36 L per kWh
- US data centres, 2023
- about 66 billion litres used on site
06
Why water wins
Now fill the same hall with air-cooled racks. In this model each one draws 10 kW, so the whole hall carries about a twelfth of the power. Air cannot do much better: in practice, an air-cooled rack tops out at about 20 to 35 kW. To carry away 120 kW with air, about 32,600 m³ of it would have to pass through one cabinet every hour.
Next to the rack, a laptop sits on a desk. Its charger is rated at 40 W, so one rack at full load matches 3,000 of them. Run at full load all year, one rack uses as much electricity as about 100 US homes, or 270 in the EU. ENIAC was one of the first electronic computers. In 1945 it drew 150 kW, a little more than this one rack. It weighed about 27 tonnes and filled a whole room.
Sites are also compared by their PUE, short for power usage effectiveness. It is the site's power divided by the computers' power, so a perfect site would score 1. The industry average is about 1.5, which means about 35 percent of the power never reaches a computer. Google's fleet averaged 1.09 in 2025, leaving only 8 percent for cooling and losses.
This toggle changes which site you compare against, not how the rack is cooled. No study gives PUE for air and liquid cooling separately, so the model does not tie the two together. Whichever you pick, the energy path ends the same way: as warm air above the roof.
- One rack at full load
- 120 kW
- Air to carry that heat
- 32,640 m³/h
- Homes, over a full year
- about 97 US or 270 EU homes
- Laptop chargers
- 3,000 at 40 W each
- PUE
- 1.54, industry average
- Not for computing
- 35% of site power